


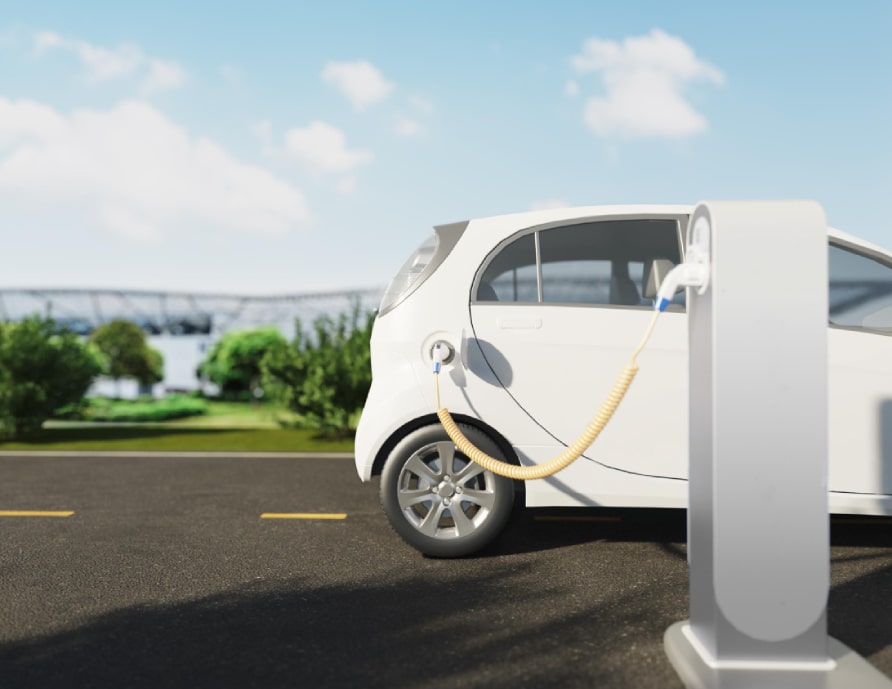
The objection is a fair one and it comes up constantly: India generates most of its electricity by burning coal, so an electric vehicle here is really a coal-powered vehicle, and calling it clean is marketing.
It deserves a proper answer rather than a slogan. This page works the sum through with published figures and stated assumptions, includes the emissions from manufacturing the battery, and compares an e-rickshaw against the vehicles it actually replaces.
The short version: even on today’s grid, an e-rickshaw emits roughly half to two-fifths of what a CNG or petrol auto-rickshaw emits per kilometre. The long version, with the workings, follows.
The grid figure everything rests on
The Central Electricity Authority publishes a CO2 baseline database for the Indian power sector. The all-India weighted average emission factor for FY 2024-25 is approximately 0.710 tCO2 per MWh — that is 710 g CO2 per kWh generated.
Worth noting the trend, because it changes the conclusion over a vehicle’s life:
| Period | tCO2/MWh | g CO2/kWh |
|---|---|---|
| Roughly a decade ago | 0.774 | 774 |
| FY 2023-24 | 0.727 | 727 |
| FY 2024-25 | 0.710 | 710 |
That is a slow decline, but it is a decline, and it runs one way. An electric vehicle bought today gets cleaner every year it operates as generation shifts. A CNG auto bought today emits exactly the same in year eight as in year one.
Assumptions
All of them, so you can substitute your own.
- E-rickshaw energy at the pack: 45 Wh per km, a loaded vehicle on an urban route.
- Charging efficiency: 95% for lithium, 75% for lead-acid.
- Transmission and distribution losses: 17%, so delivered energy is 83% of generated energy.
- Grid factor: 710 g CO2/kWh at generation.
- CNG auto: 30 km per kg; burning CNG produces about 2.75 kg CO2 per kg.
- Petrol auto: 30 km per litre; petrol produces about 2.31 kg CO2 per litre burned.
- Upstream fuel emissions: roughly 10% added for CNG, 20% for petrol, covering extraction, processing and distribution.
The e-rickshaw calculation
Work backwards from the wheels to the power station.
The pack delivers 45 Wh per km. Charging at 95% efficiency means the wall supplies 45 ÷ 0.95 = 47.4 Wh per km. Accounting for 17% T&D losses, the generating station must produce 47.4 ÷ 0.83 = 57.1 Wh per km.
At 710 g CO2 per kWh: 0.0571 kWh × 710 = 40.6 g CO2 per km.
On lead-acid, the 75% charging efficiency pushes the same calculation to about 51 g per km — roughly 27% worse for identical transport. Switching a fleet from lead-acid to lithium cuts emissions by a quarter before anything else changes.
What it is competing against
A CNG auto at 30 km/kg burns 33.3 g of CNG per km, producing 33.3 × 2.75 = 91.7 g CO2 at the tailpipe. Adding 10% upstream gives about 101 g per km.
A petrol auto at 30 km/l burns 33.3 ml per km, producing 77 g at the tailpipe. Adding 20% upstream gives about 92 g per km.
| Vehicle | g CO2/km | Relative |
|---|---|---|
| E-rickshaw, lithium | 41 | Baseline |
| E-rickshaw, lead-acid | 51 | +25% |
| Petrol auto-rickshaw | 92 | +126% |
| CNG auto-rickshaw | 101 | +148% |
So the coal objection, taken seriously and calculated honestly, does not survive. Even with 710 g/kWh generation and 17% grid losses, electrification more than halves emissions per kilometre. The reason is not clean generation — it is that an electric drivetrain is roughly three times as efficient at turning stored energy into motion as an internal combustion engine, and that efficiency advantage is large enough to overwhelm a dirty grid.
What about making the battery?
This is the fair follow-up, and leaving it out would make the comparison dishonest.
Manufacturing lithium cells is energy-intensive. Published estimates vary widely with chemistry and where the factory draws its power, but a commonly cited range is 50 to 100 kg CO2 per kWh of battery capacity. LFP generally sits at the lower end, having no cobalt or nickel to mine and refine.
Take a 6 kWh e-rickshaw pack at 75 kg CO2 per kWh: about 450 kg CO2 embodied. Spread across a realistic 150,000 km service life, that is 3 g CO2 per km.
Adding it: 41 + 3 = 44 g per km. The comparison barely moves, and the reason is cycle life. A pack that lasts 3,000 cycles amortises its manufacturing emissions across an enormous distance.
Which points at something worth noticing: the lead-acid comparison gets worse here, not better. Lead-acid packs are replaced three or four times over the same period, so their embodied emissions are incurred repeatedly. Longevity is itself an environmental property, and it is the same property that makes lithium cheaper — as our cost of ownership guide works through in rupees rather than carbon.
CO2 is not the pollutant most people in Delhi care about
Everything above measures carbon dioxide, which is a climate question. For anyone living in an Indian city, the more immediate question is what they are breathing, and on that measure the comparison is not close at all.
An internal combustion auto-rickshaw emits its pollutants at street level, in traffic, among pedestrians. A coal plant emits at a stack, typically a hundred kilometres from the city, through equipment designed to capture particulates. Those are not equivalent exposures even when the mass emitted is similar.
| ICE auto-rickshaw | E-rickshaw | |
|---|---|---|
| Point of emission | Street level, in traffic | Power station, usually far away |
| Particulate control | Vehicle-scale, degrades with age | Plant-scale, maintained and regulated |
| NOx at street level | Yes | None |
| Exposure to pedestrians | Direct | None locally |
| Emissions when stationary in traffic | Yes, engine idling | None |
| Noise | Significant | Minimal |
The idling row matters more than it looks. An auto-rickshaw stopped at a signal is still burning fuel and still emitting; an e-rickshaw draws nothing. In dense urban traffic a substantial fraction of an engine’s running time is spent stationary, and all of it is pure loss.
This does not make an e-rickshaw emission-free — the power station is real and so are its emissions. But the health burden of urban air quality falls overwhelmingly on the people sharing the street with the vehicle, and moving the emission out of the street is a genuine improvement independent of the carbon arithmetic.
Two caveats worth stating plainly. Coal generation produces its own serious local pollution, borne by the communities around the plant rather than by city residents — that is a shifting of burden, not an elimination of it. And an e-rickshaw still produces particulates from tyre and brake wear, as every vehicle does.
Where the numbers could be wrong
Three assumptions above are genuinely contestable, and it is worth saying which way each cuts.
The grid factor is an average. Charging overnight, when coal makes up more of the mix, is dirtier than charging at midday when solar is contributing. A charging depot that shifts load into daylight hours does better than 710 g/kWh; one that charges exclusively at 2 am does worse. This cuts both ways depending on your operation.
Energy consumption varies more than the sum suggests. 45 Wh/km assumes a reasonably driven, properly maintained vehicle. An overloaded rickshaw with under-inflated tyres and a dragging brake can use 60 Wh/km, which would take the figure to about 54 g per km. Still well ahead, but the margin narrows.
Comparison vehicles are not identical. An e-rickshaw is slower and carries four passengers; a CNG auto is faster and typically carries three. On a per-passenger-kilometre basis the e-rickshaw looks better still, but they are not serving quite the same journeys.
None of these reverses the conclusion. All of them are worth knowing if you intend to quote the figure.
Per passenger, and over a lifetime
Per-kilometre figures compare vehicles. Per-passenger-kilometre figures compare transport, which is what people actually buy.
An e-rickshaw typically carries four passengers; an auto-rickshaw three. Dividing through:
| Vehicle | g CO2/km | Passengers | g CO2/passenger-km |
|---|---|---|---|
| E-rickshaw, lithium | 41 | 4 | 10.3 |
| E-rickshaw, lead-acid | 51 | 4 | 12.8 |
| Petrol auto | 92 | 3 | 30.7 |
| CNG auto | 101 | 3 | 33.7 |
On that basis the gap widens to roughly three to one. Shared electric transport at low occupancy still comfortably outperforms shared combustion transport at its typical occupancy.
Now scale it to a working life. A commercial e-rickshaw covering 30,000 km a year over five years does 150,000 km.
- E-rickshaw, lithium: 150,000 × 44 g (including the battery) = 6.6 tonnes CO2
- CNG auto: 150,000 × 101 g = 15.2 tonnes CO2
A difference of roughly 8.6 tonnes over five years, per vehicle. For an operator running twenty vehicles, that is 172 tonnes — and the same decision that produces it also saves them money, which is the useful part. Environmental arguments that require sacrifice are hard to scale. This one does not.
And the figure improves without any further action, because the grid factor keeps falling. A vehicle bought today at 710 g/kWh will spend its later years on a cleaner grid than its first. Nothing comparable happens to a CNG auto.
How to do better than the average
If the grid factor is what limits you, the obvious move is to charge from something other than the grid.
A charging depot with rooftop solar displaces grid electricity directly during daylight, and daylight is when a fleet’s vehicles are frequently standing between shifts anyway. Solar generation carries a lifecycle emission factor around 40–50 g CO2/kWh — roughly a fifteenth of the grid figure. A depot meeting half its charging demand from its own array takes an e-rickshaw from about 41 g per km to roughly 21 g.
That is not a hypothetical exercise; it is a straightforward commercial installation, and the economics usually work on electricity cost alone before any environmental argument. We cover the sizing and the commercial case in our guide to solar-powered charging for fleets and commercial sites.
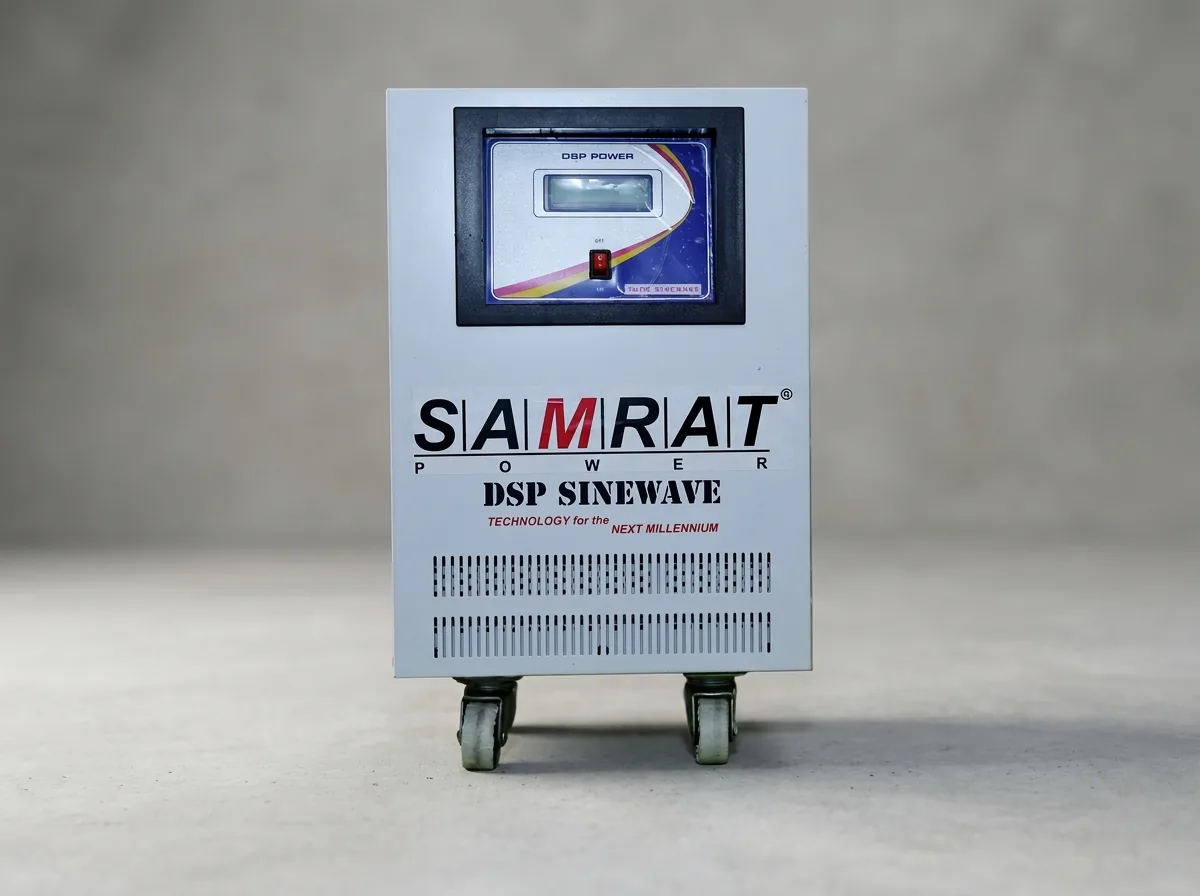
Solar Inverter · DSP Sine Wave
Hybrid solar PCU for homes, shops and small depots — runs the load on solar by day and stored power by night, with seamless mains bypass.
₹37,760 incl. GST · 24-month warranty
What the figure leaves out
Three things sit outside this calculation, and all three currently favour the electric vehicle rather than against it.
End of life. A retired LFP pack at 80% capacity is a usable stationary storage battery, and the recovered materials from one that is genuinely finished displace virgin mining. Neither credit is counted above — the 3 g/km for battery manufacture assumes the pack is simply consumed. Our piece on Li-ion recycling in India covers both routes.
Vehicle manufacturing. Excluded from both sides, on the reasonable assumption that building an e-rickshaw glider and building an auto-rickshaw are broadly comparable. An electric drivetrain has far fewer moving parts than an engine and gearbox, so if anything this omission favours the combustion vehicle.
Maintenance consumables. Engine oil, filters, exhaust components and clutch parts over five years, none of which an electric vehicle consumes.
The comparison above is therefore conservative. A fuller accounting would widen the gap rather than narrow it.
The honest summary
An e-rickshaw on India’s current grid emits roughly 41 g CO2 per kilometre, or 44 g including the battery’s manufacture. A CNG auto emits about 101 g and a petrol auto about 92 g. Electrification cuts emissions by more than half despite coal-heavy generation, because an electric drivetrain is far more efficient than a combustion engine.
Three things improve it further, in descending order of how much they are within your control: charging from solar rather than the grid, choosing lithium over lead-acid, and simply keeping the vehicle well maintained. And one improves without any effort from you at all — the grid keeps getting cleaner, and every vehicle already on the road gets cleaner with it.
Figures here are drawn from the CEA CO2 baseline database for the Indian power sector; grid emission factors are revised annually and worth checking against the current version before quoting.